Debugging code and understanding where and how to view errors is an important part of development on the HubSpot CMS. There are a number of tools you can use to increase efficiency when building and debugging and to make sure your website is optimized as you continue to build it out.
For information on viewing code alerts in HubSpot, check out HubSpot’s Knowledge Base.
Errors
The HubSpot CMS developer file system has many forms of validation to ensure your templates and modules render correctly on pages.
Fatal errors
Fatal errors are errors that would prevent a page from successfully rendering. To ensure live content renders correctly, the HubSpot CMS prevents publishing templates that have fatal errors. An example of a fatal error would be missing required HubL variables, such as standard_header_includes. This will cause errors when developing in the Design Manager or when uploading files through the CMS CLI. The VS Code Extension supports HubL linting, and can display the fatal errors in-context ahead of uploading the file.
Fatal errors must be resolved in order to publish files.
Warnings
Warnings are errors or issues that do not prevent the publishing of files, and are often suggestions in syntax or potential issues a developer might be missing. The VS Code Extension supports HubL linting, and can display the warnings in-context ahead of uploading the file. For example, you would see a warning if you tried to include a non-existent file.
Debug mode on live pages
You can enable debug mode on a live page by loading the page with a ?hsDebug=true query string in the URL.
Please note: debug mode isn’t supported on system pages, such as 404 and password pages.
- With non-minified files.
- With non-combined CSS files (individual CSS files served).
- Without serving cached files.
In addition, when you load a page with ?hsDebug=true, debugging information will be added to the bottom of the page source code, including:
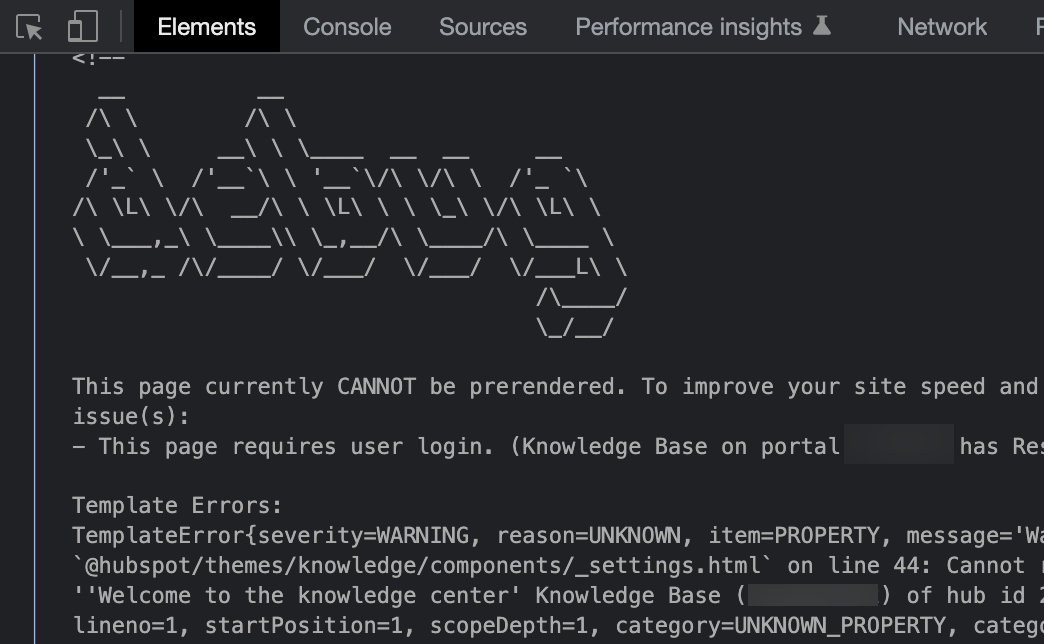
- Whether the page can be prerendered, and the reasons why if it cannot be prerendered.
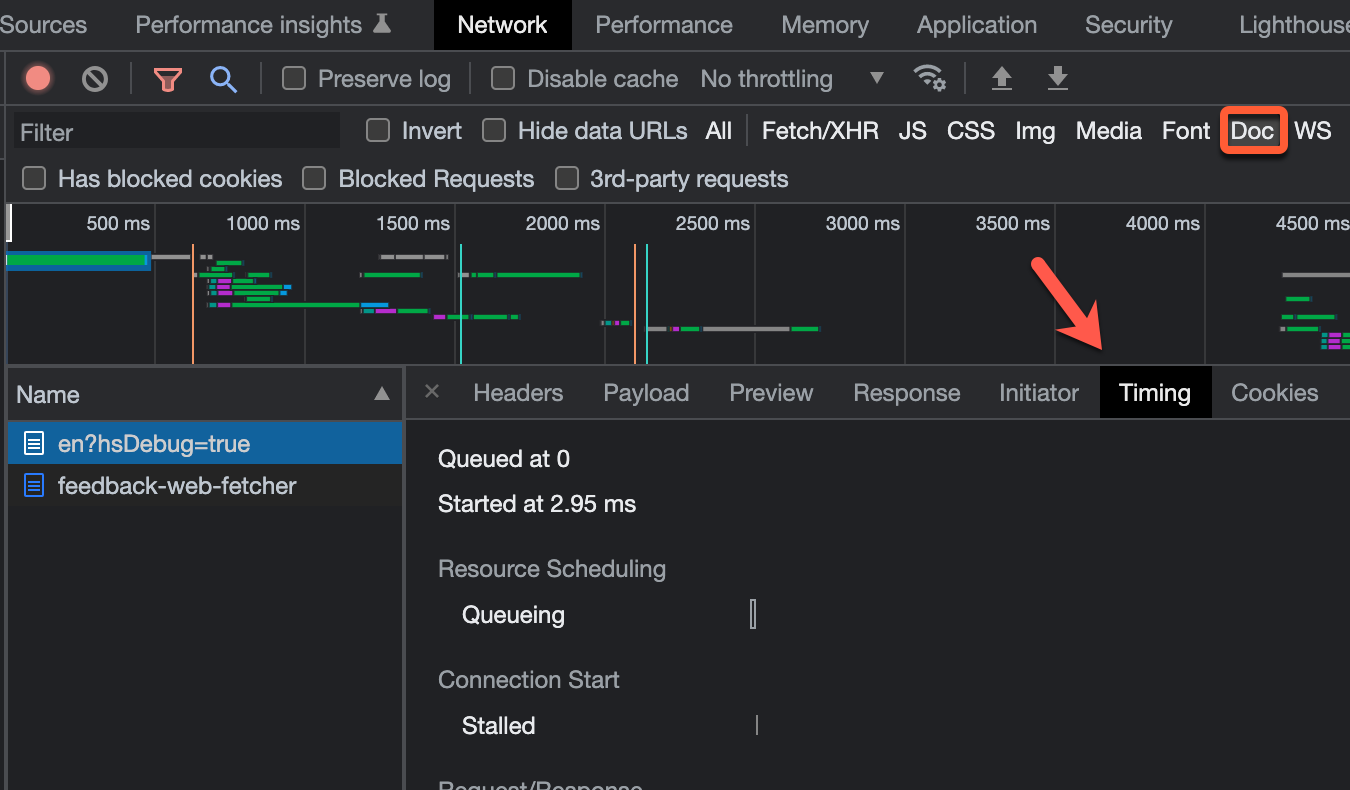
- A breakdown of rendering request timing, which can be helpful for knowing which page components take longer to render. This breakdown will also be added to the Timing tab in your browser’s developer console under Doc requests.
- Errors and warnings, such as HubL function limits or missing files.
Developer mode in the page editor
You can also load the page editor in HubSpot with the query string to enable developer features, such as copy sections as HubL and the ability to open specific modules in the design manager from the page editor.
- In the page editor, add the following parameter to the URL, then press Enter:
?developerMode=true.
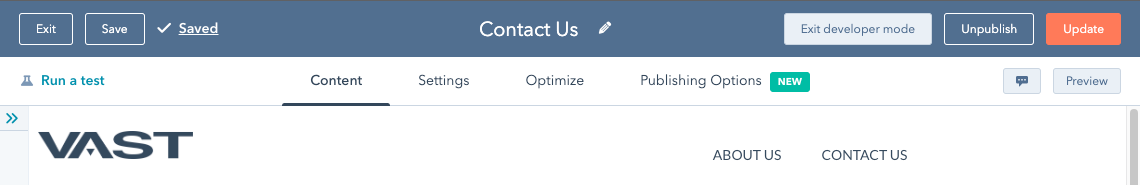
- With the page reloaded, you’ll now be in developer mode. You can exit developer mode at any time by clicking Exit developer mode in the upper right.
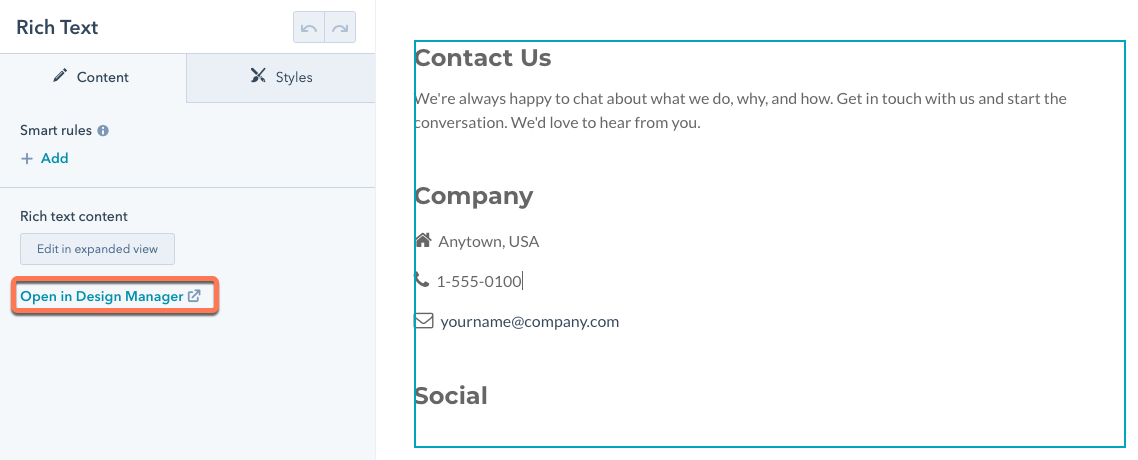
While you’re in developer mode, you can navigate to the code for a specific module by clicking the associated module, then clicking Open in design manager in the sidebar editor.
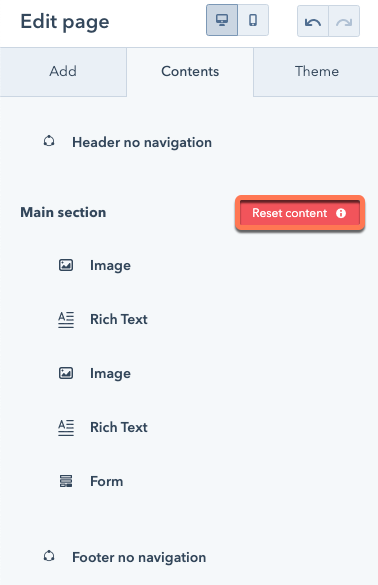
You can also reset any unpublished changes back to the default content of the template:
- Click the Contents tab.
- To the right of template name, click Reset content.
- In the dialog box, click Yes, reset.
View HubL output
Within the design manager, you can use the Show output toggle to open a second code editor panel containing a transpiled version of the file. This is helpful to see how your HubL code will transpile into CSS, HTML or JavaScript, rather than reloading live pages the file is included on. It is also a helpful tool to use when exploring new features of HubL, or learning the basics of HubL as you can easily see what your HubL input will output to.
|pprint HubL filter
The |pprint HubL filter can be used on HubL variables to print valuable debugging information. It will print the type of HubL variable, which can be useful in understanding what expressions, filters, operators or functions it can be used with.
For example, {{ local_dt }} will print 2020-02-21 12:52:20. If we pretty print this variable, we can see the value is a date (PyishDate: 2020-02-21 12:52:20). This means we can use HubL filters that operate or format date objects, such as the |datetimeformat HubL filter.
{{ local_dt }}
{{ local_dt|pprint }}
{{ local_dt|datetimeformat('%B %e, %Y') }}
2020-02-21 12:55:13 (PyishDate: 2020-02-21 12:55:13) February 21, 2020
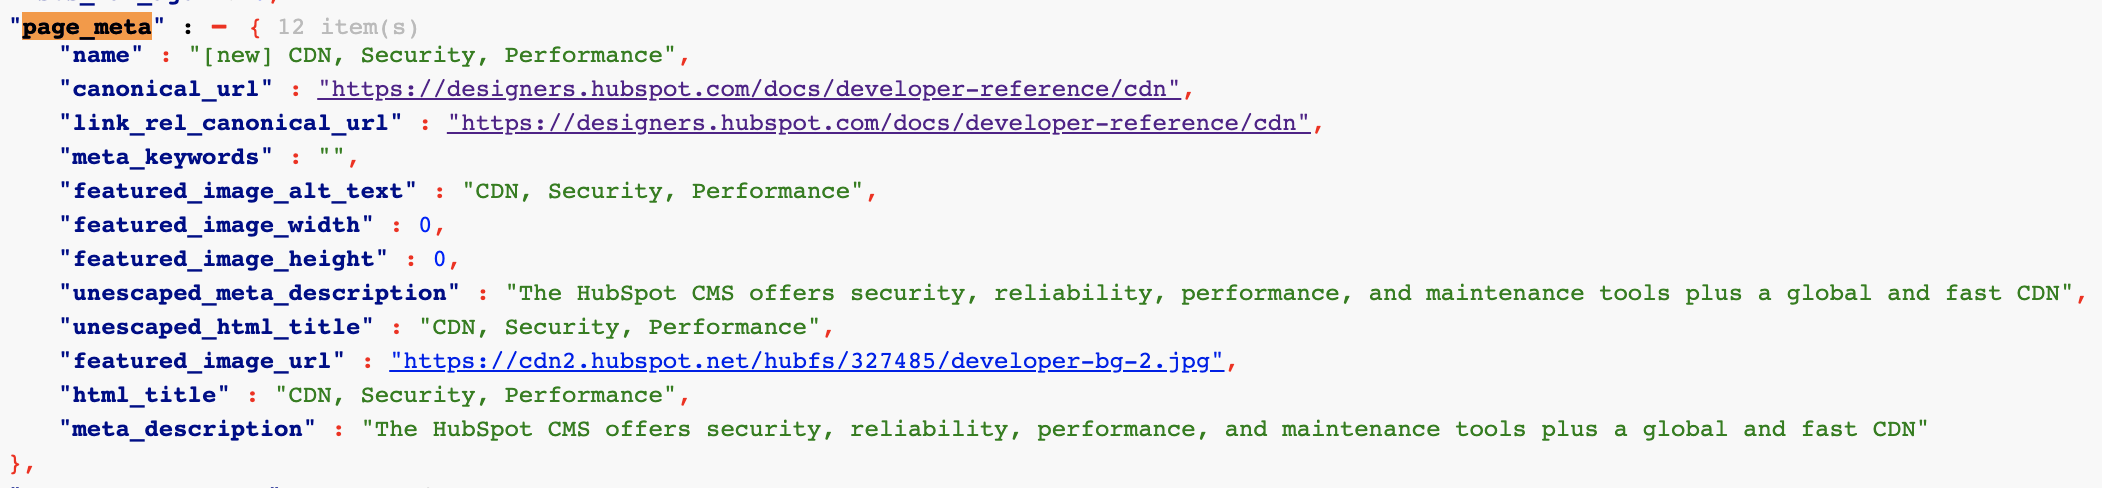
Developer info
Please note: much of the data found in developer info is used internally, and is subject to change if not otherwise documented.
<title>{{ page_meta.html_title }}</title>
<meta name="description" content="{{ page_meta.meta_description }}">