
HubSpot has powerful built-in analytics tools that allow HubSpot users to access and analyze data for website traffic, sales, and other important metrics that provide valuable insights for your business. With these insights, businesses can make data-driven decisions to improve their online presence, attract more visitors, and potentially convert more leads into customers. Using the Analytics API, you can use this same data in external tools or dashboards.
The Analytics API can seem very complex when you're first looking into it, but there are a few options that work together to provide access to data through the API just like a user would when working in their HubSpot tools. The main thing to keep in mind is that it's designed around the HubSpot analytics tools. If you're not already familiar with these tools, I'd recommend checking out our help articles for using the traffic analytics tool.
The endpoint we'll be using is the get analytics data breakdowns endpoint. There are a few main components to using this endpoint.
- First is the
/:breakdown_bypath parameter. This parameter controls how the returned data is broken down. For example, you can return the data broken down by traffic source (organic search vs. direct traffic), geolocation, or just get the totals for all traffic from all sources. - Next is the
/:time_periodpath parameter. This parameter controls how the data is aggregated. This could be daily, weekly, monthly. This can also be used to get the totals for all of the breakdowns specified in the/:breakdown_byparameter./totals/totals- Get just the totals for all traffic sources/sources/total- Get the total traffic broken down by traffic source/sources/daily- Get the traffic broken down by source for each day
- Combining these two parameters gives you control over which data you get and how it's broken down:
- You'll also need the
start=andend=query parameters, used to specify the start and end dates of the data being requested. These are set using theYYYYMMDDformat.
Before we get into examples, there are a few things to keep in mind:
- The examples below are heavily truncated in the interest of making them readable. Some fields that are normally present in the response may not be included in all (or, in fact, in any) of the examples below. Please see the Analytics API overview for the full list of fields.
- The
visitsfield in the response corresponds to the sessions displayed in the analytics tools. The API still uses the termvisitsfor backwards compatibility. - You can find more information about how traffic is categorized in HubSpot in this knowledge base article.
- For more details about the metrics returned by the API, see the metrics definitions in our help documentation.
Getting Started
We're going to start with the main sources analytics view. To keep things simple, we'll be looking at a set date range, from January 1, 2022 through January 31, 2022 (set using the start=20220101&end=20220131 query parameters).
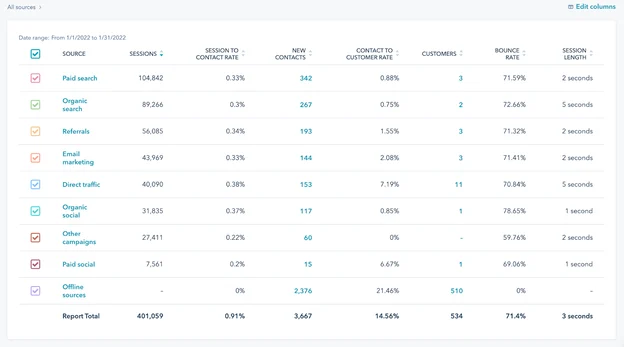
If you want the details you'd see in the table, you can use the sources parameter for the :breakdown_by, with the total parameter for the :time_period. Each entry in "breakdowns" in the response will be a separate source, which would be what you'd see in the left column of the table pictured above:
You can also get this data broken down by day (or week or month) by using daily for the :time_period. The returned data will use the dates as the top level data, with a breakdown of the sources data for each date:
Drilldowns
In order to get more details for a specific source, we'll use another feature of this API: drilldowns. Drilldowns let you dive deeper into the data, and are based on the "breakdowns" you get back from the higher level report. Using the traffic tools in HubSpot as our point of reference, using a drilldown with the API is essentially the same as clicking on one of the sources to see more details.
Let's use referrals for our example. If you're viewing all sources, and you click on referrals, you can see the specific referral sites:
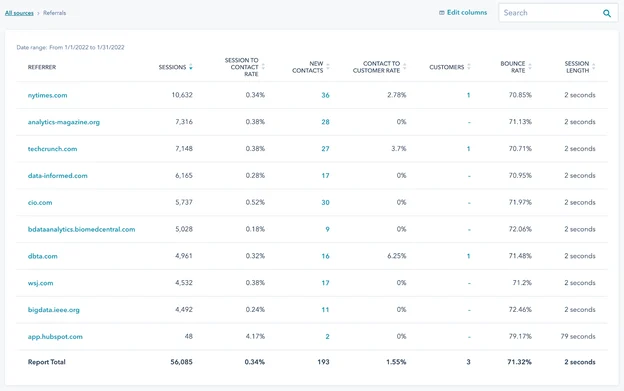
You set the drilldowns using the d1 and d2 query parameters, so we can get that data using the d1 query param set to d1=referrals. Just like in the analytics tools in HubSpot, this will break down the data by the domains where the referral traffic came from:
In the analytics tools, we can drill down further into the data by clicking a specific site. For referrals, this shows us the specific URLs that the traffic came from:
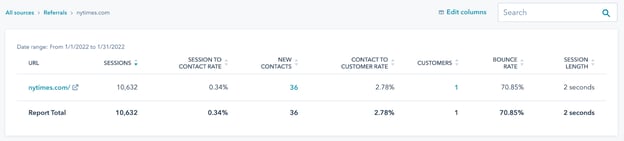
Using the API, we do this using the d2 query parameter, set to a domain from the breakdowns in the previous response:
When using drilldowns, the main thing to keep in mind is that they're based on higher level data. Looking at the referral examples above, for instance, you won't know the specific domains you can use for the d2 drilldown until you pull the first level drilldowns using d1=referrals and then look at the "breakdown" fields in the response.
Filters
Next, let's look at filters. Filters limit the results to only include the breakdowns you specify. Filters are set using the f= query parameter, and you can include the parameter multiple times to set multiple filters. For example, if you only want the sources data for social media and referrals, you can limit the response to only include those sources:
Filters also work within a drilldown. If you're looking at visits from social media sources, you can limit the results to the sites most important to your business:
Filters can be a good way to keep your responses below the data point limit when looking at larger time periods. If you're pulling daily sources data over a long period of time, filters can be a good way to keep the number of breakdowns in the response data below that data point cap. You can find more details about data limits in the Analytics API overview.
Sorting
Last, let's look at sorting. The sort= query parameter can be used to sort the results in descending order based on the specified field. You can sort by any of the fields in the "breakdowns" part of the response. This works in a similar way to clicking on a header in the table when viewing the data in the HubSpot analytics tools.
For example, you can sort the results by the number of contacts generated from the traffic source.
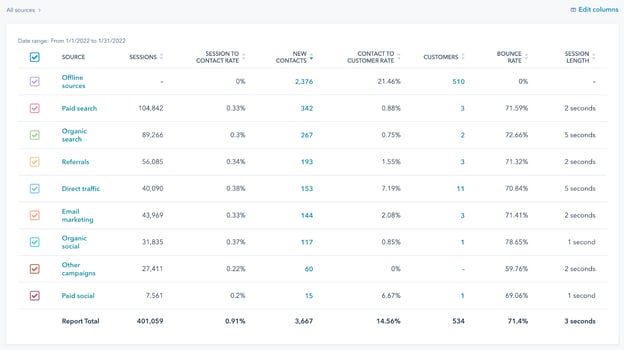
You can get the same sort order from the API by using sort=contacts in the URL:
Sorting can work with any of the available fields within the breakdown data, and can also work within a drilldown. For example, you can sort the results from social media sites based on the average number of page views coming from those visits:
Conclusion
Overall, the HubSpot Analytics API gives you the power to access and analyze your website traffic data. The number of options available may seem overwhelming at first—but if you're used to working with the Sources report, you can see how a few specific parameters can help you understand how the data is structured and how to pull the data you want. With some development work, we've shown how you can use the Analytics API to retrieve the metrics and breakdowns that are most important to your business, letting you make data-driven decisions to improve your performance and execute your needs.